Thursday, March 21, 2013

Lab 8


Report of 2009 Station Fire
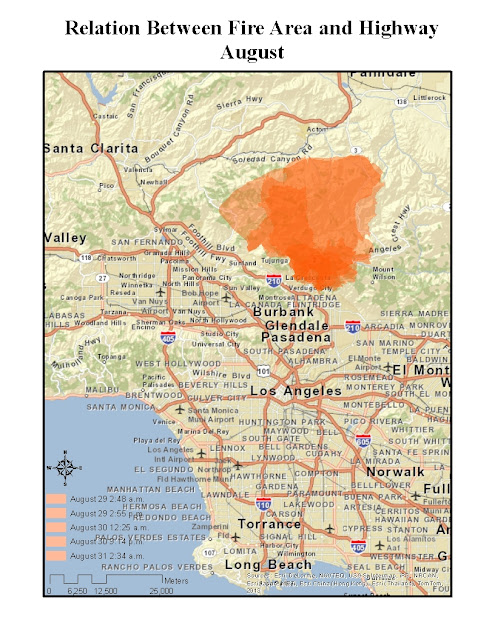
The two maps above are showing the topography of Los Angeles and the extent of 2009 Station Fire in August and September. According to the maps, we can tell that the main on fire region is the Southwest part of the Angeles Nation Forest. The fire started on August 26 afternoon, caused by unknown arsonist, initially ignited on the forest near the Angeles Crest Fire Station, on the Angeles Crest Highway. The surrounding environment was very dry and in steep terrain(see the map of elevation) cover with highly flammable vegetation, which was mature chaparral, at least 50 years old, standing six to eight feet tall (United States Department of Agriculture Forest Service, 2009). Finally, until it was declared contained on October 16, the station fire destroyed 89 houses, killed two firefighters and burned more than 160,000 acres of land in Los Angeles County (United States Government Accountability Office, 2011). 


        Then, I am going to talk about the threat and risk of the station fire. Known as the largest wildfire in the history of Los Angeles County, the station fire caused huge negative effects on residents’ properties, surrounding public facilities and even people’s health. Fortunately, according to the Los Angeles population density map, the on fire region has a low population, therefore, no residents was hurt, except two firefighters. However, since most houses in fire region are used by owners them selves, whose household income is usually in high level, the houses were all well built and decorated. Therefore, the cost of those 89 destroyed houses is huge.


        In addition, the fire also threaded the public facilities, such as highway, TV signal towers and observatory on Mountain Wilson. Just like what the maps and the government report show, the fire region is really close to the highway nearby, once even crossed the Angeles Crest Highway (GAO, 2011). That create many problems for fire engines to get to the proper fire spot and the steep terrain also makes helicopters hard to reach the right place. 


        From the other two maps, we can find that there are two TV signal towers and an observatory on Mountain Wilson, where is really close to the fire region. During the station fire, those facilities were under huge threat. Serious damage could interrupt cellphone service, television and radio programming for those who receive signals over the air, as well as some emergency law enforcement communications (Knoll & Becerra, 2009). “A lot of people think of an observatory as one dome, but Mt. Wilson Observatory is actually a 40-acre tract of land with 50 to 60 buildings on it,” McAlister (2010) said. “None of that stuff is portable, and to move telescopes out of there takes many weeks. We're strictly at the mercy of nature and the great competence of the firefighters.” The observatory houses multimillion-dollar astronomy projects for UCLA, USC and UC Berkeley. Therefore, the station fire could also cause serious economic loss the society on the fields of science research.


          Last and most important thing is about residents' health. When people expose to the wildfire, the smoke can hurt people's respiratory tract and lead to many sequelae. The professionals calculated that one need to pay $84.42 per exposed per son per day to recover from the problems made by wildfire smoke (Richardson, Champ & Loomis, 2012)


         In conclusion, the 2009 station fire put huge risk and threat on many fields of our society including personal properties, public facilities and even human health.


Reference
Knoll, C. & Becerra, H. (2009). TV signals from Mt. Wilson at risk. Los Angeles Times.
McAlister, H. A. (2010). Diary of a Fire: The 2009 Station Fire Threat to Mount Wilson Observatory
Richardson, L. A., Champ, P. A. & Loomis, J. B. (2012). The hidden cost of wildfires: Economic valuation of health effects of wildfire smoke exposure in Southern California. Journal of Forest Economics, 18, 14–35.
United States Department of Agriculture Forest Service (2009). Fire and Aviation Management Station Fire Initial Attack Review. Report of the Review Panel.
United States Government Accountability Office (2011). Forest Service’s Response Offers Potential Lessons for Future Wildland Fire Management. Report to Congressional Requester. 


Thursday, March 7, 2013

lab 7

Lab 7: Census 2000/2010


Population of Asian in U.S. (in percent)

        This map is about the distribution of Asian in U.S.. In this map, darker the yellow is, higher the percentage of Asian population is in that area. We can obviously find that most Asians live in California, Washington and east coast around New York. I believe that the distribution of Asian is mostly effected by economy. According to U.S. Census Bureau, Current Population Survey, 1968 to 2012 Annual Social and Economic Supplements, household income of Asian for 2011 is $65,129, while the average income of all races is $50,054. We can say that the Asian in U.S. is usually pretty rich who is willing to have a higher standard life and earn more money. Therefore, it is very easy to understand why Asian prefer to live in New York, California and Washington, since these places contain well developed cities and nice environment, which can provide a higher life standard and more business opportunities.
  

Population of Black in U.S. (in percent)
        This map is about the distribution of black in U.S.. In this map, darker the grey is, higher the percentage of black population is in that area. According to this map, states in southeastern part of America, such as Mississippi, Alabama and Geogia, are where Black people mostly live in. In my opinion, there are two reasons which lead to this knd of distribution. First reason is related to the history of black. Before the Civil War, most black were living in the South, although many of them moved to the North after the war, there were still many left and keep living in there. The second reason is about economy. As U.S. Census Bureau, Current Population Survey, 1968 to 2012 Annual Social and Economic Supplements say, the household income of a black family in 2011 is $32,229, while the average of all races is $50,054. Then we can see that most black are having relativly pool lives. Therefore, they tend to stay in the states which are not so developed and cost less to live.


Population of Other Race in U.S. (in percent)


        This map is about the distribution of other races in U.S.. In this map, darker the purple is, higher the percentage of other race population is in that area. We can find that people from other races prefer to live in Southwestern part of America. Races in America other than Asian, Black and White is mostly Hispanic, many of whom are from Central and South America. So, I think that the environment and international relationship are the main reasons of their population distribution. Since most Hispanic come to America from the country boundary between Mexico and America, they would get into New Mexico and Texas. While those immigrants are usually not very rich, they will need to find a job as soon as possible. Then, they will probably settle down in those states. As a result, the density of other races people is highest in these area.


Thursday, February 21, 2013

lab 6

National Elevation Dataset
 
The spacial reference : GCS_North_American_1983.
 The angular unit : Degree (0.0174532925199433).
The datum : D_North_American_1983.
 
Extent:
Top : 39.8291666661°;
Left : -105.788888889°;
 Right : -104.969444445°;
Bottom : 39.3838888883°.


3D image

lab 5

Equal Area:


Equidistant:


Conformal:


The map projection gives people the ability to move the image on a sphere surface to a flat surface. That helps people to have a better general view of the image and enables people to collect data easier from the image. I did experienced the significance of map projection in this map projections exercise. However, we need to pay attention that since the curve of the surface has changed, images can never be exactly the same as the original ones. What we can do is just keep one element the same, such as distance or area, and than use one specific method according to that element. In future, we might be able to create a method which can keep two or more elements exactly the same, which must be able to give people more help than present.

Then, I am going to talk about three kinds of map projections, which are equal area, equidistance and conformal projections. First of all, for the equal area projections, I choose Mollweide projection and Gall Orthographfic, which also known as Gall-Peter projection, to be examples. Although both of them are equal area maps, they still have different features. Mollweide is a pseudo-cylindrical map projection, which has accurate proportions in area. On the other hand, Gall-Peter projection is one specialization of a configurable equal-area map projection known as cylindrical equal-area projection. The standard parallels of the Gall–Peters are 45° N and 45° S. 


Secondly, for the equidistance projections, I choose the Plate carree projection, which is an equirectangular projection centered at the equator, and the Azimuthal equidistant projection, whose distances along great circles radiating from centre are conserved. Because those two projections use different method to keep the proportion of distance the same, the exact distance between Washington D.C. and Kabul from two maps are different.


Finally, for the conformal projections, I choose the Mercator projection, whose Rhumb lines are represented by straight segments, and Stereographic projection, in which  any circle of a sphere, great and small, maps to a circle or straight line.

P.S. Information is from Wikipedia.
http://en.wikipedia.org/wiki/Map_projection#Conformal


Thursday, February 14, 2013

Lab 4


In these two weeks, we learned the basic usage of the ArcGIS software. In order to practice, we did a series of exercises and finally created a group of maps on the topic of the expansion of airport and the effect of its noise. During this process, I learned a lot and had a fun experience.


The ArcGIS software has many advantages. It simplifies the process of making a map and increases the accuracy of map. At the same time, the software makes map making, which can only did by professionals in the past time, nowadays, become handleable for non-professionals, such as students. Moreover, the ArcGIS trained our logical thinking ability, since you have to make map steps by steps. It also trained our sense of spatial, so that we can have a better idea of how our word looks like after finish those maps.


However, the ArcGIS also has some disadvantages which need to be improved. First of all is the automatic saving function. The ArcGIS has to have the function of automatic saving so that people will not lost their valuable work by accident, since it really takes a long time to finish a good map. The second point is timing. Although it is handleable for normal people, the steps are still so complicated that people can hardly finish the work individually at the first several times.  Moreover, there are so many steps we need to keep repeating, such as adding north arrow, legend and scale bar. I believe the program can be more simplified so that we only need to add those tuffs once for all the maps in the same group.


In conclusion, ArcGIS is a great software which helps people to have a better idea about how to create maps, and, at the same time, trained people’s mind. Of course, it also has some disadvantages, but I believe that it can become more powerful after those improvements.


Thursday, January 24, 2013

Week 3


View Ancient Egyptian Culture Trip in U.S. in a larger map


This map is about major Museums in U.S., which have ancient Egyptian collections. I am glad that almost every state has at least one museum which has some Egyptian collections. With the help of Google Map, I can easily mark they out and give a general view of their locations and density.

The blue points and the pictures are where the museums located. The density of museum in east coast in so high that I have to mark them as points in order to make it clear. Most Museums are located in east and west coast (the area I have marked out). Moreover, the quantity and quality of collection in those museums are usually very high. On the other hand, although other states have museums with ancient Egyptian collections as well, according to their website, the quantity are often very low. Some might only have one or two collections. Therefore, we can tell that people's interest in art is proportion to people's economy ability. 


The neogeography is interesting to use. It helps us to get the sense of what information does a map need and let normal people have a chance to make their own map. 

However, it also has some disadvantages. If everyone can make their own maps and publish them, it will be hard to control the quality of maps. There might be many fake information and mistakes. At the same time, it will be hard to keep everyone updating their maps. As a result, many maps will become out of date.


In conclusion, although neogeography has some weakness, we can still take advantages of it. Moreover, I believe that it has some potential. 


Thursday, January 17, 2013

Week 2 Lab


1. What is the name of the quadrangle?
        
           Beverly Hills


2. What are the names of the adjacent quadrangles?

   Canoga Park, van Nuys, Burbank, Topanga, Hollywood, Venice, Inglewood


3. When was the quadrangle first created?
  
   1966


4. What datum was used to create your map?

   North American Datum of 1927
   North American Datum of 1983
   National Geodetic Vertical Datum of 1929
5. What is the scale of the map?


1: 24000


6. At the above scale, answer the following:
a) 5 centimeters on the map is equivalent to how many meters on the ground?


   5cm × 24000 = 120000cm = 1200m


b) 5 inches on the map is equivalent to how many miles on the ground?


   5inches × 24000 = 120000inches = 1.89mile


c) one mile on the ground is equivalent to how many inches on the map?


   1mile / 24000 = 1/24000miles = 2.64inches


d) three kilometers on the ground is equivalent to how many centimeters on the map?


   3km / 24000 = 1/8000km = 12.5cm


7. What is the contour interval on your map?
  
    20 feet


8. What are the approximate geographic coordinates in both degrees/minutes/seconds and decimal degrees of:
a)the Public Affairs Building;

34°04'N, 118°26'30"W

b) the tip of Santa Monica pier;

34°00'30"N, 118°30'W


c) the Upper Franklin Canyon Reservoir;

34°06'30"N, 118°24'30"W


9. What is the approximate elevation in both feet and meters of:
a) Greystone Mansion (in Greystone Park);

550 feet (167.64m )


b) Woodlawn Cemetery;

140 feet ( 42.67m )


c) Crestwood Hills Park;

720 feet ( 219.46m )


10.  What is the UTM zone of the map?

   Zone 11

11.  What are the UTM coordinates for the lower left corner of your map?
  
   3763000m N, 361500m E


12.  How many square meters are contained within each cell (square) of the UTM gridlines?
  
   1000m ×1000m = 1×10⁶ m2
13.  Obtain elevation measurements, from west to east along the UTM northing 3771000, where the eastings of the UTM grid intersect the northing. Create an elevation profile using these measurements in Excel (hint: create a line chart). Figure out how to label the elevation values to the two measurements on campus. Insert your elevation profile as a graphic in your blog.


      14.  What is the magnetic declination of the map?

   14°


15.  In which direction does water flow in the intermittent stream between the 405 freeway and Stone Canyon Reservoir?
   
North to South
16.  Crop out (i.e., cut and paste) UCLA from the map and include it as a graphic on your blog.